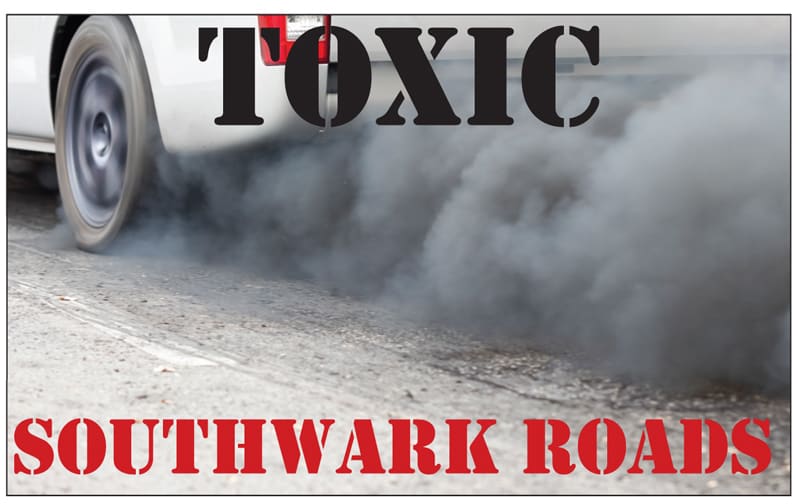
Forty-four locations in Southwark failed air quality targets in 2017 according to research published on Wednesday – with two being among the top ten most polluted in London.
The data audit, conducted by environmental group Friends of the Earth, mapped locations which did not meet the UK air quality target of 40ug/m3 for nitrogen dioxide, a pollutant linked to lung problems.
Twenty spots in Southwark recorded pollution levels over 60ug/m3.
Two – the area surrounding Haddon Hall on Tower Bridge Road, and Peckham High Street – recorded levels more than double the limit, a whopping 90.79ug/m3 and 87.51ug/m3 respectively.
This means both sites, which are on TfL-managed roads, are among the top ten most polluted locations in London, say campaigners.
Catriona Currie, a campaigner with the group, said: “It’s unforgivable to see so many locations across London over air quality limits, leaving millions of us breathing dangerously polluted air.
“There are however signs of hope for air quality in the city, with Sadiq Khan making some good progress with the Ultra Low Emission Zone.”
Other locations which failed air quality targets even include areas surrounding the borough’s schools.

The Notre Dame Girls’ School in Elephant and Castle; Globe Academy School also in Elephant and Castle; St James’ CoE Primary School in Bermondsey; and Camberwell’s Oliver Goldsmith Primary School were among those listed in areas breaking clean air limits.
Friends of the Earth called for the Mayor’s ultra-low emissions zone (ULEZ) scheme, due to be introduced in April, to be extended to cover the whole of Greater London.
Cllr Richard Livingstone, Southwark Council’s cabinet member for Environment, Transport Management and Air Quality, said it would support the idea of a ULEZ extension to cover the whole of Southwark and Greater London.
However he added that there was “concern” that “where the border ends could become a new pollution hotspot – it’s important that we continue to work with TfL and with neighbouring boroughs on the issue of pollution.”
“Tackling air pollution is one of the council’s priorities as it is something that concerns residents in relation to their long-term health,” said Cllr Livingstone, pointing to a crackdown on engine idling.

The council was aware of the locations, he added, and has met TfL this week to discuss traffic calming measures on Peckham High Street and cycling routes on Tower Bridge Road.
Cllr Graham Neale, the environment spokesperson for the opposition Liberal Democrats, said the report showed “we need to work harder to keep our air clean for everyone, London’s boroughs need to work together to stop this invisible killer.”
He called for cycle hire schemes to be extended beyond Elephant and Castle to Peckham and Rotherhithe – and also said the council should reconsider vehicle leases for council staff.
“[It] looks like a case of saying one thing, and doing another – a kind of ‘eco double speak,’” he said.
The findings come after Mayor Sadiq Khan sounded a ‘high’ pollution alert across London on Tuesday.
“Poorly dispersed local emissions” were attributed to the alert by the Mayor’s office, only the tenth time it has been used since Mr Khan took over the role.
The alert was “evidence of the scale of London’s air quality crisis” said a Mayoral spokesperson.
REVEALED: ALL 44 sOUTHWARK POLLUTION HOTSPOTS
BOROUGH AND BANKSIDE:
1) Blackfriars Road SE1 – Annual Mean NO2 (ug/m3): 53.0
2) Park St Southwark Bridge Rd – Annual Mean NO2 (ug/m3): 54.38
3) Borough High Street – Annual Mean NO2 (ug/m3): 82.27
4) 125 Borough High St – Annual Mean NO2 (ug/m3): 70.99
5) Little Dorritt Park Entrance – Annual Mean NO2 (ug/m3): 60.14
6) Borough High Street / Harper Road Junction – Annual Mean NO2 (ug/m3): 43.02
7) 43 Westminster Bridge Road – Annual Mean NO2 (ug/m3): 76.28
ELEPHANT AND CASTLE AND WALWORTH
8) Notre Dame School – Annual Mean NO2 (ug/m3): 46.82
9) New Kent Road – Annual Mean NO2 (ug/m3): 56.43
10) New Kent Road, near Rodney Place – Annual Mean NO2 (ug/m3): 70.84
11) Elephant & Castle near to St Mary’s Churchyard – Annual Mean NO2 (ug/m3): 44.7
12) Walworth Road opposite junction to Elephant Road – Annual Mean NO2 (ug/m3): 77.25
13) Newington Causeway – Annual Mean NO2 (ug/m3): 71.7
14) Globe Academy School Harper Road – Annual Mean NO2 (ug/m3): 47.04
15) 239 Walworth Road – Annual Mean NO2 (ug/m3): 57.04
16) 351 Walworth Road – Annual Mean NO2 (ug/m3): 45.26
17) 80 Camberwell Road – Annual Mean NO2 (ug/m3): 80
BERMONDSEY AND ROTHERHITHE:
18) Bricklayers Arms West – Annual Mean NO2 (ug/m3): 57.14
19) Haddon Hall Tower Bridge Road – Annual Mean NO2 (ug/m3): 90.79
20) Papa John’s Tower bridge Road – Annual Mean NO2 (ug/m3): 86.87
21) Tower Bridge School fence Tower Bridge Road -Annual Mean NO2 (ug/m3): 62.56
22) Tower Bridge Approach Tower Bridge Road -Annual Mean NO2 (ug/m3): 70.72
23) St James’ CoE Primary School Jamaica Road – Annual Mean NO2 (ug/m3): 43.53
24) 52 Jamaica Road – Annual Mean NO2 (ug/m3):65.39
25) 188A Lower Road – Annual Mean NO2 (ug/m3): 73.42
26) Rotherhithe Old Road – Annual Mean NO2 (ug/m3): 47.6
27) Beechwood Court 3 Crystal Palace Parade – Annual Mean NO2 (ug/m3): 52.43
OLD KENT ROAD, PECKHAM AND CAMBERWELL:
28) 221 Old Kent Road – Annual Mean NO2 (ug/m3): 69.41
29) 375 Old Kent Road – Annual Mean NO2 (ug/m3): 66.03
30) Old Kent Road, near Asylum Road – Annual Mean NO2 (ug/m3): 42
31) 11 Camberwell Church Street – Annual Mean NO2 (ug/m3): 55.1
32) Coldharbour Lane, Camberwell – Annual Mean NO2 (ug/m3): 50.49
33) De Crespigny Park, Camberwell – Annual Mean NO2 (ug/m3): 44.14
34) Oliver Goldsmith School Southampton Way – Annual Mean NO2 (ug/m3): 46.97
35) 88A Peckham High Street – Annual Mean NO2 (ug/m3): 87.51
36) 14 Hanover Park, Peckham – Annual Mean NO2 (ug/m3): 72.24
37) 167A Rye Lane – Annual Mean NO2 (ug/m3): 41.7
38) 201 Rye Lane – Annual Mean NO2 (ug/m3): 43.12
39) 168 Queens Road – Annual Mean NO2 (ug/m3): 42.0
HERNE HILL AND DULWICH:
40) 91 Herne Hill – Annual Mean NO2 (ug/m3): 41.63
41) 1d Calton Avenue – Annual Mean NO2 (ug/m3):41.18
42) Etherow Street – Annual Mean NO2 (ug/m3): 43.35
43) Dulwich Common – Annual Mean NO2 (ug/m3):41.2
44) South Circular Road Junction with Underhill Road- Annual Mean NO2 (ug/m3): 66.3


